
Introduction to Distributed Tracing
Nikolay Novik
KyivPy 22
I am ...
- Software Engineer: at DataRobot Ukraine
- Github: https://github.com/jettify
- Twitter: https://twitter.com/isinf
- aio-libs: https://github.com/aio-libs
- My Projects:
- database clients:
aiomysql, aioobc - web and etc:
aiomonitor, aiohttp-debugtoolbar, aiobotocore,
                                    aiohttp-mako, aiohttp-admin, aiorwlock, aiozipkin
- database clients:
How many of you heard of distributed tracing?
- I read Dapper paper.
- I heard about this and know key ideas.
- I think distributed tracing is kinda cool.
Problem statement
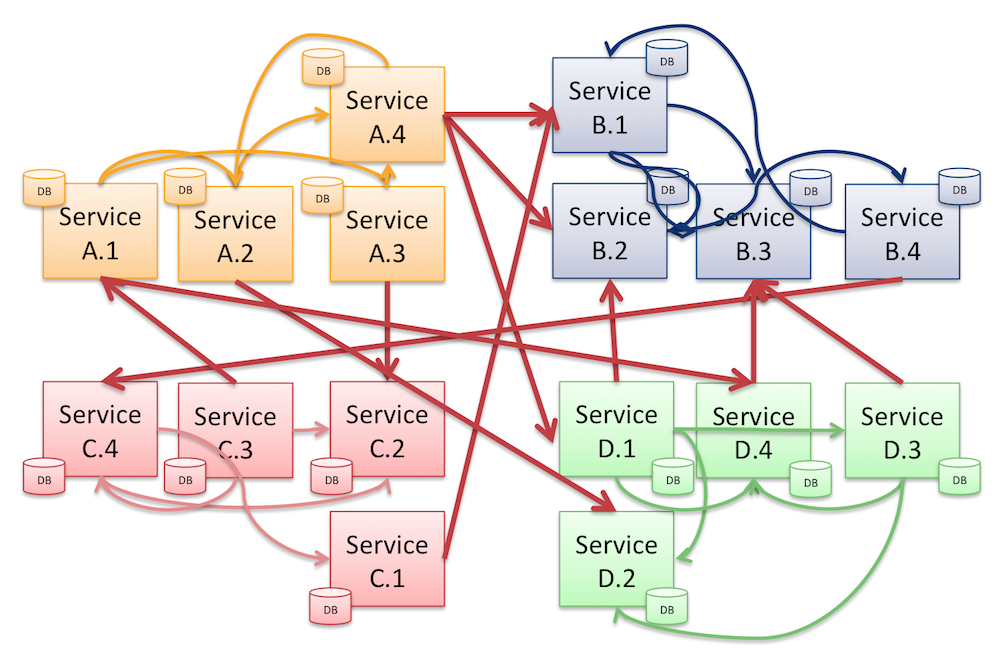
- User response are slow where is bottle neck?
- Standard tools are broken, cprofile is not helping
- How many services participate in serving this http route?
- What is going on in this madness in first place?
Tools we have: Metrics
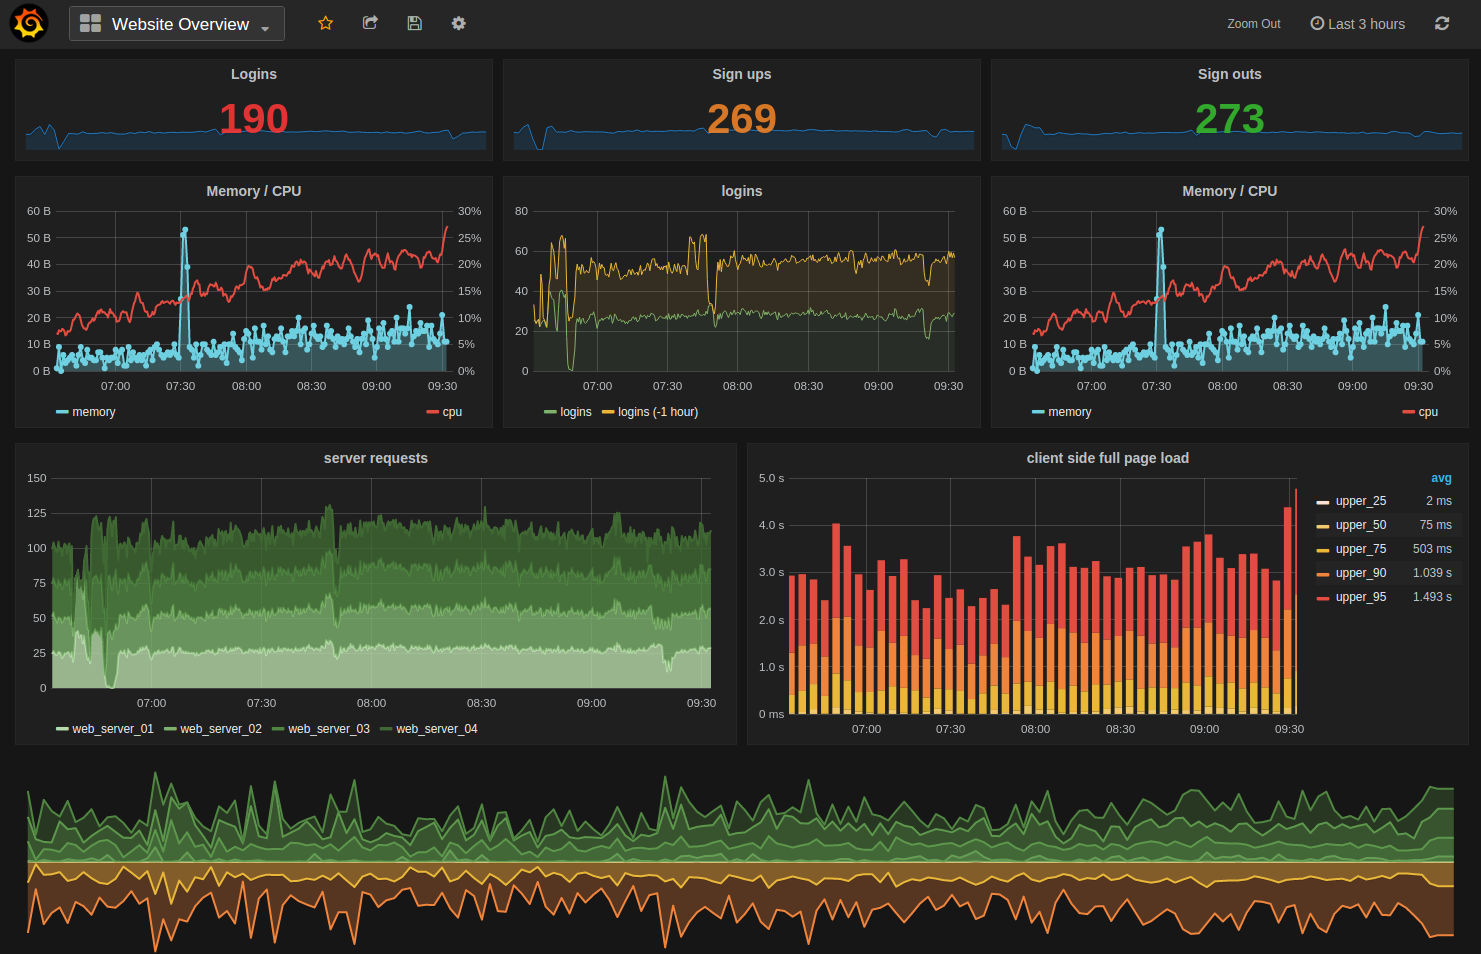
- Aggregates events per service
- Insights about trends and alerts
- No per request overview
Tools we have: Logs
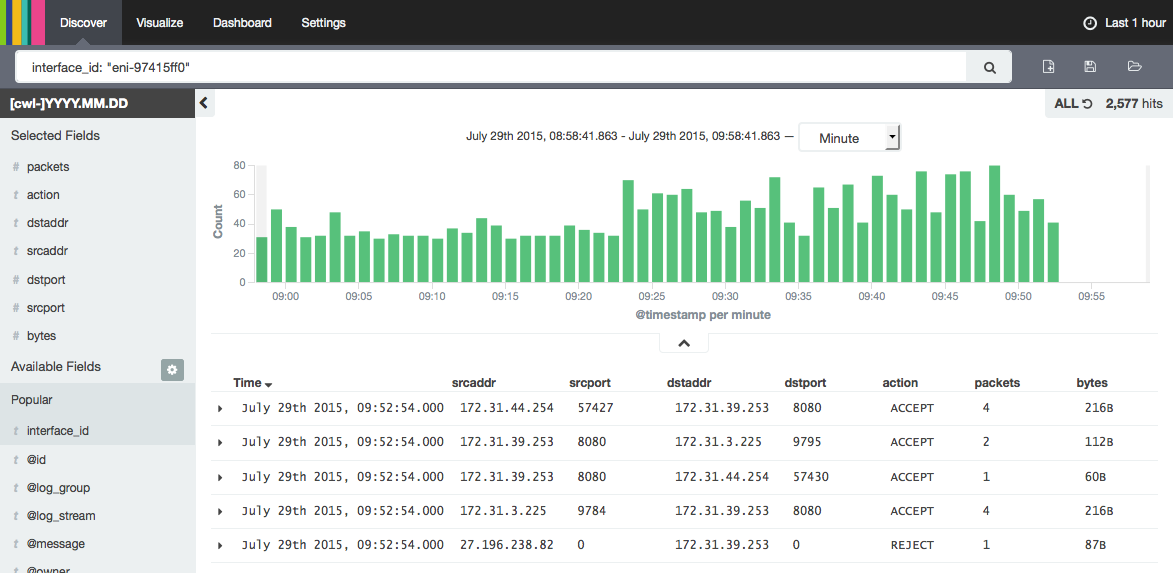
- Records discrete events
- Manual correlation
- Usually expensive
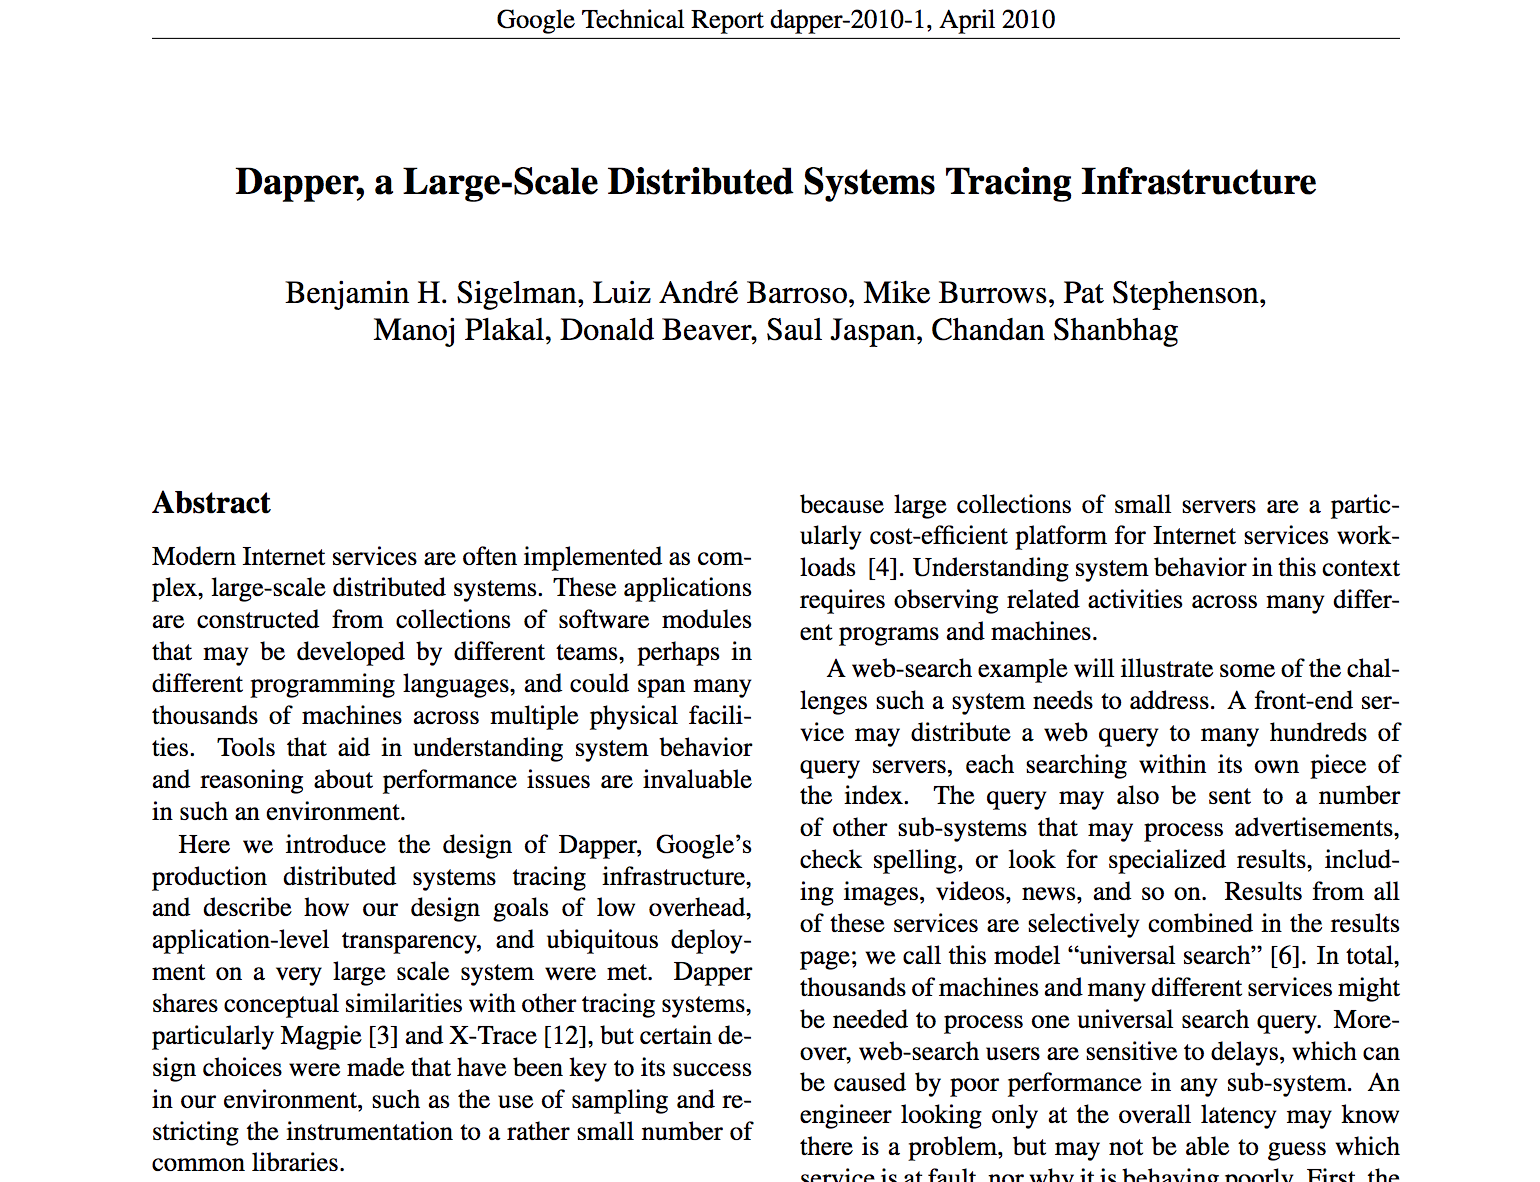
What is Distributed Tracing?
Distributed Tracing - is a tool that helps gather timing data needed to troubleshoot latency problems in service oriented architectures. Provides an end-to-end view of requests as they travel through your application, and shows a map of your application’s underlying components.
Popularity started from Google Dapper paper (2010) and microservices hype
How Dapper works
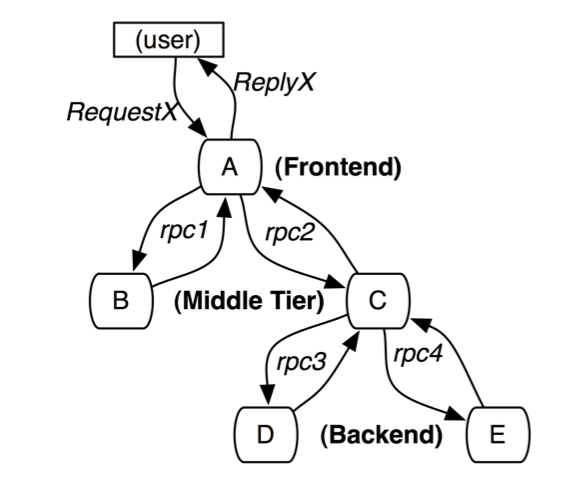
- Small context trips across process boundaries: trace_id, parent_span_id, span_id
{'X-B3-TraceId': '6f9a20b5092fa5e144fd15cc31141cd4' 'X-B3-ParentSpanId': None, 'X-B3-SpanId': '41baf1be2fb9bfc5', 'X-B3-Sampled': '1',} - Each service report time information separately
- Dapper server correlates all spans into one trace
Google Dapper Tracing Tool Goals
- Low overhead
- Application transparency
- Scalability
Google Dapper: Low overhead
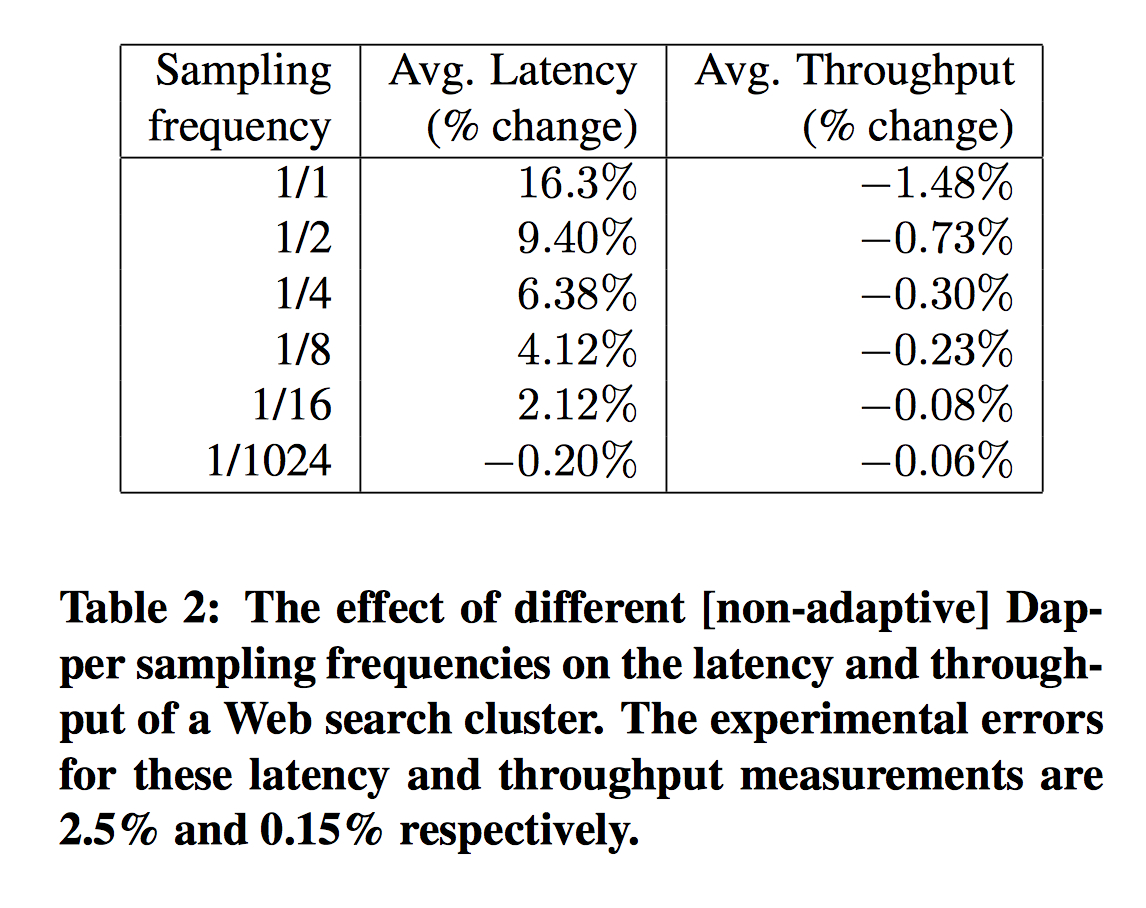
- Employ sampling to for low overhead
- Sample of just one out of thousands, provides sufficient information for many common use cases
- Low network overhead, context is tiny
Google Dapper: Scalability
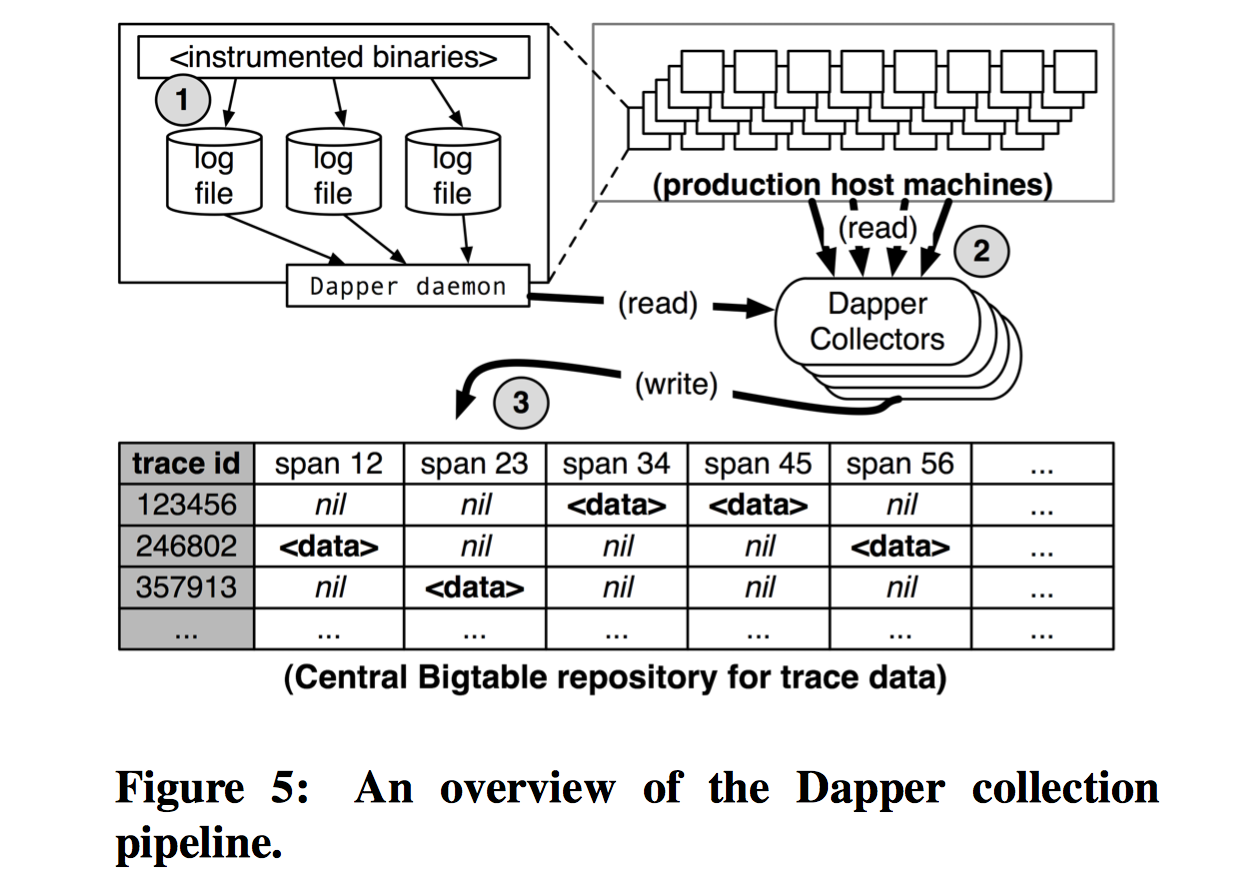
- Data written in local log files
- Collectors pulls data from all production hosts
- Results are stored in regional BigTable
Google Dapper: Application transparency
- Tracing mostly transparent for developer
- Instrumented RPC library used by all services
- Trace context sits in thread local storage, so instrumentation can pick it when required
Zipkin strait forward implementation of Dapper ideas
- Opensourced by Twitter Inc.
- https://github.com/openzipkin/zipkin
- https://twitter.com/zipkinproject
Firefighter tools
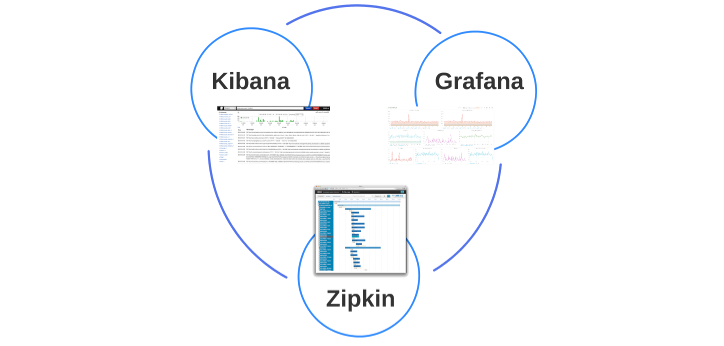
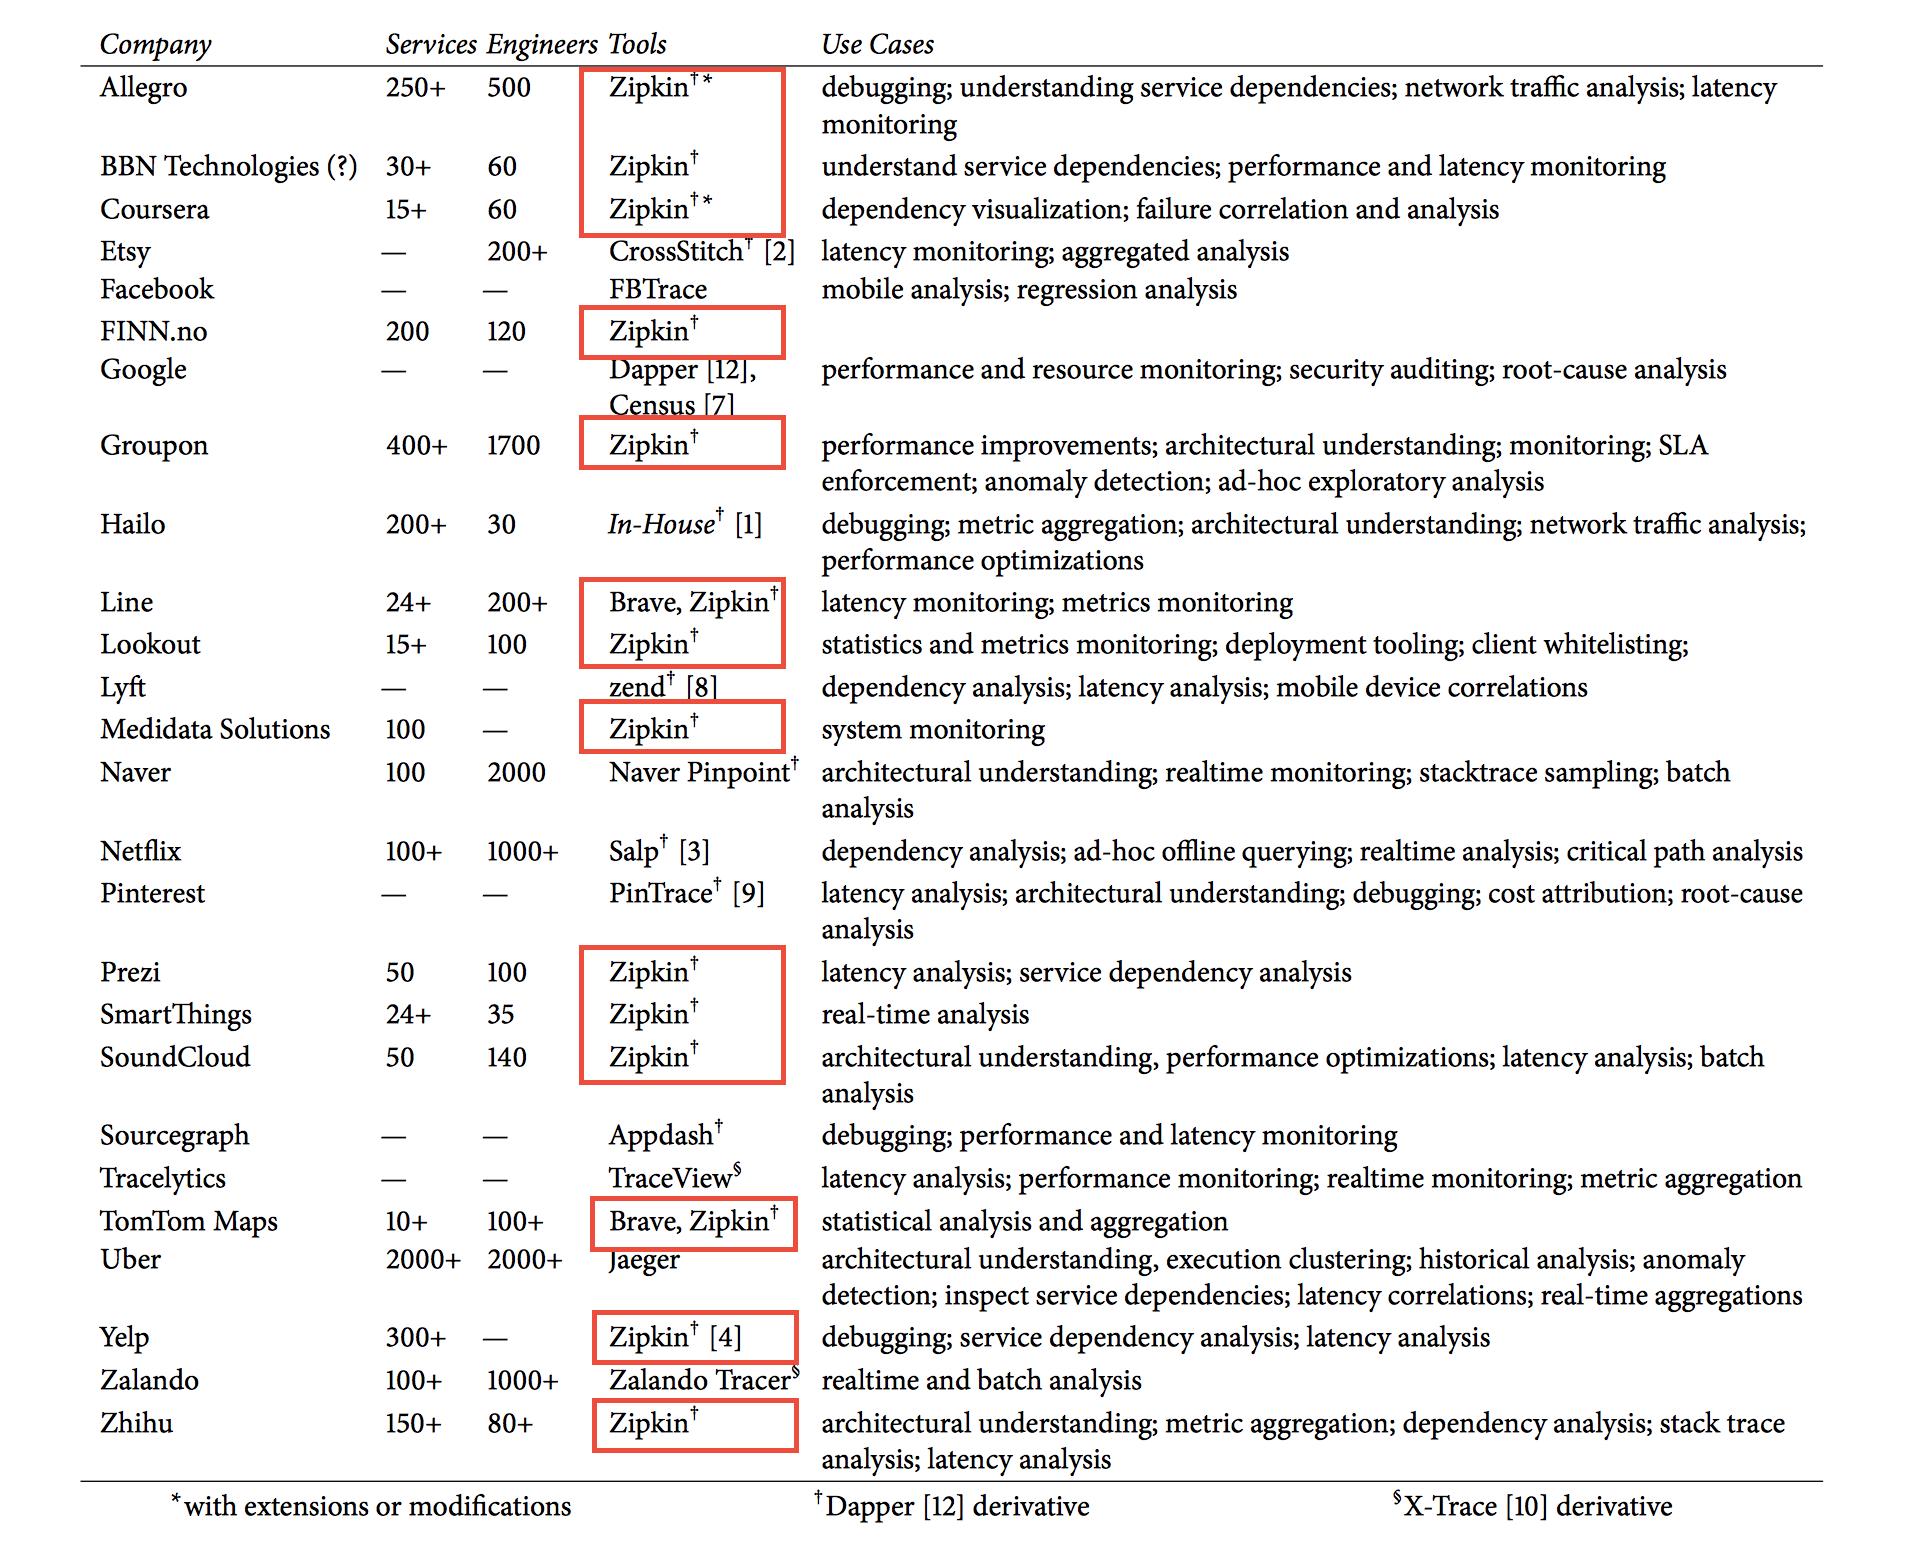
Zipkin in the wild
Other tools for Distributed tracing
Why not OpenTracing

- Lockin to one instrumentation vendor
- Wire and data interop is out-of-scope
- Monkey patching everywhere
- Things are not settled, big player still negotiate tracing cooperation between vendors
Zipkin Architecture
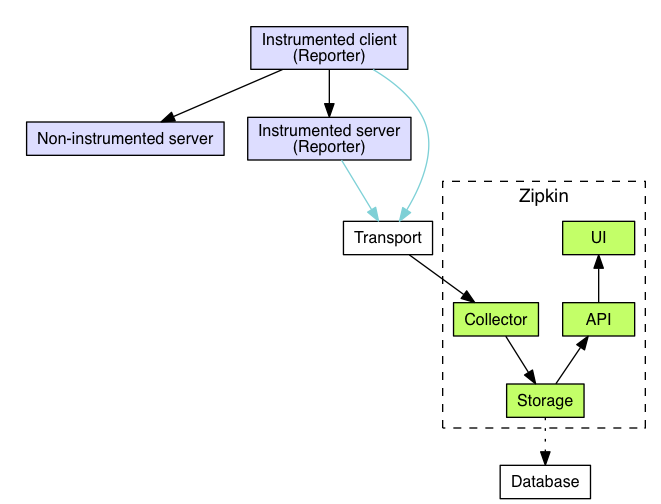
- Client and server sends spans separately
- Span correlation happens on zipkin server
Zipkin Glossary
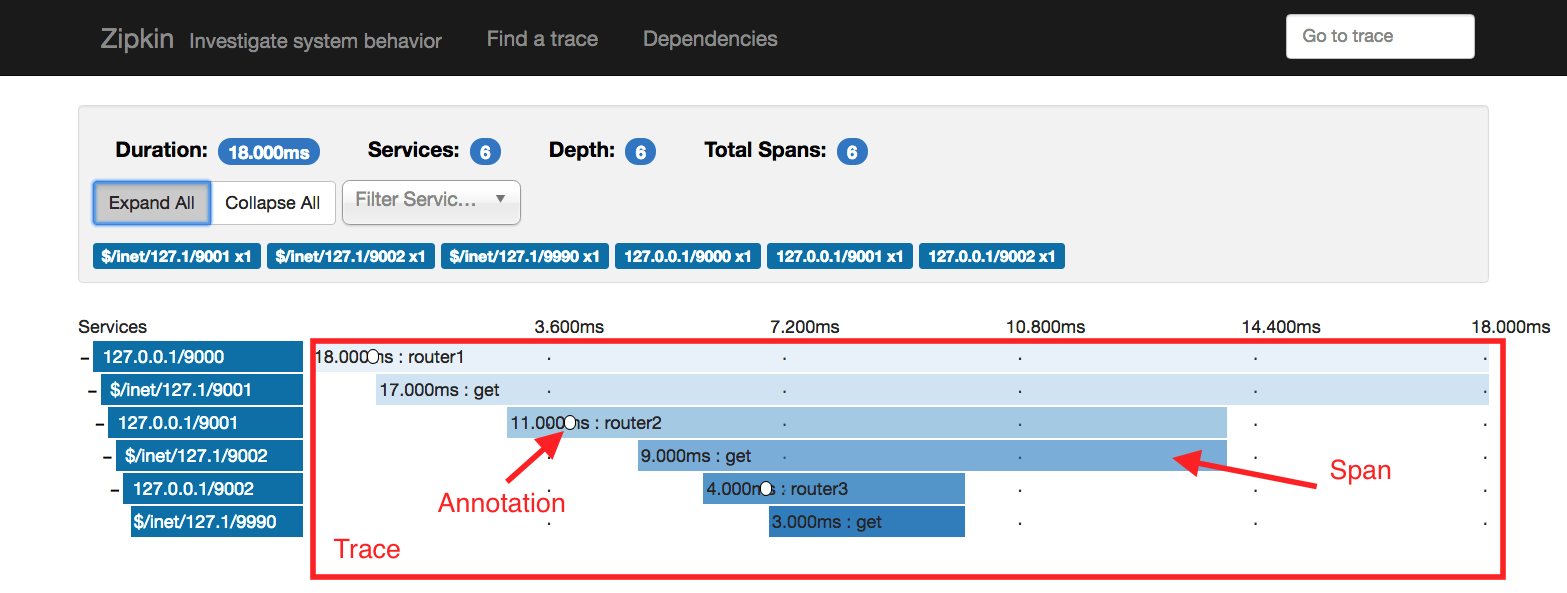
- Span represents one specific method (RPC) call
- Annotation string data associated with a particular timestamp in span
- Binary Annotation - key and value associated with given span
- Trace - collection of spans, related to serving particular request
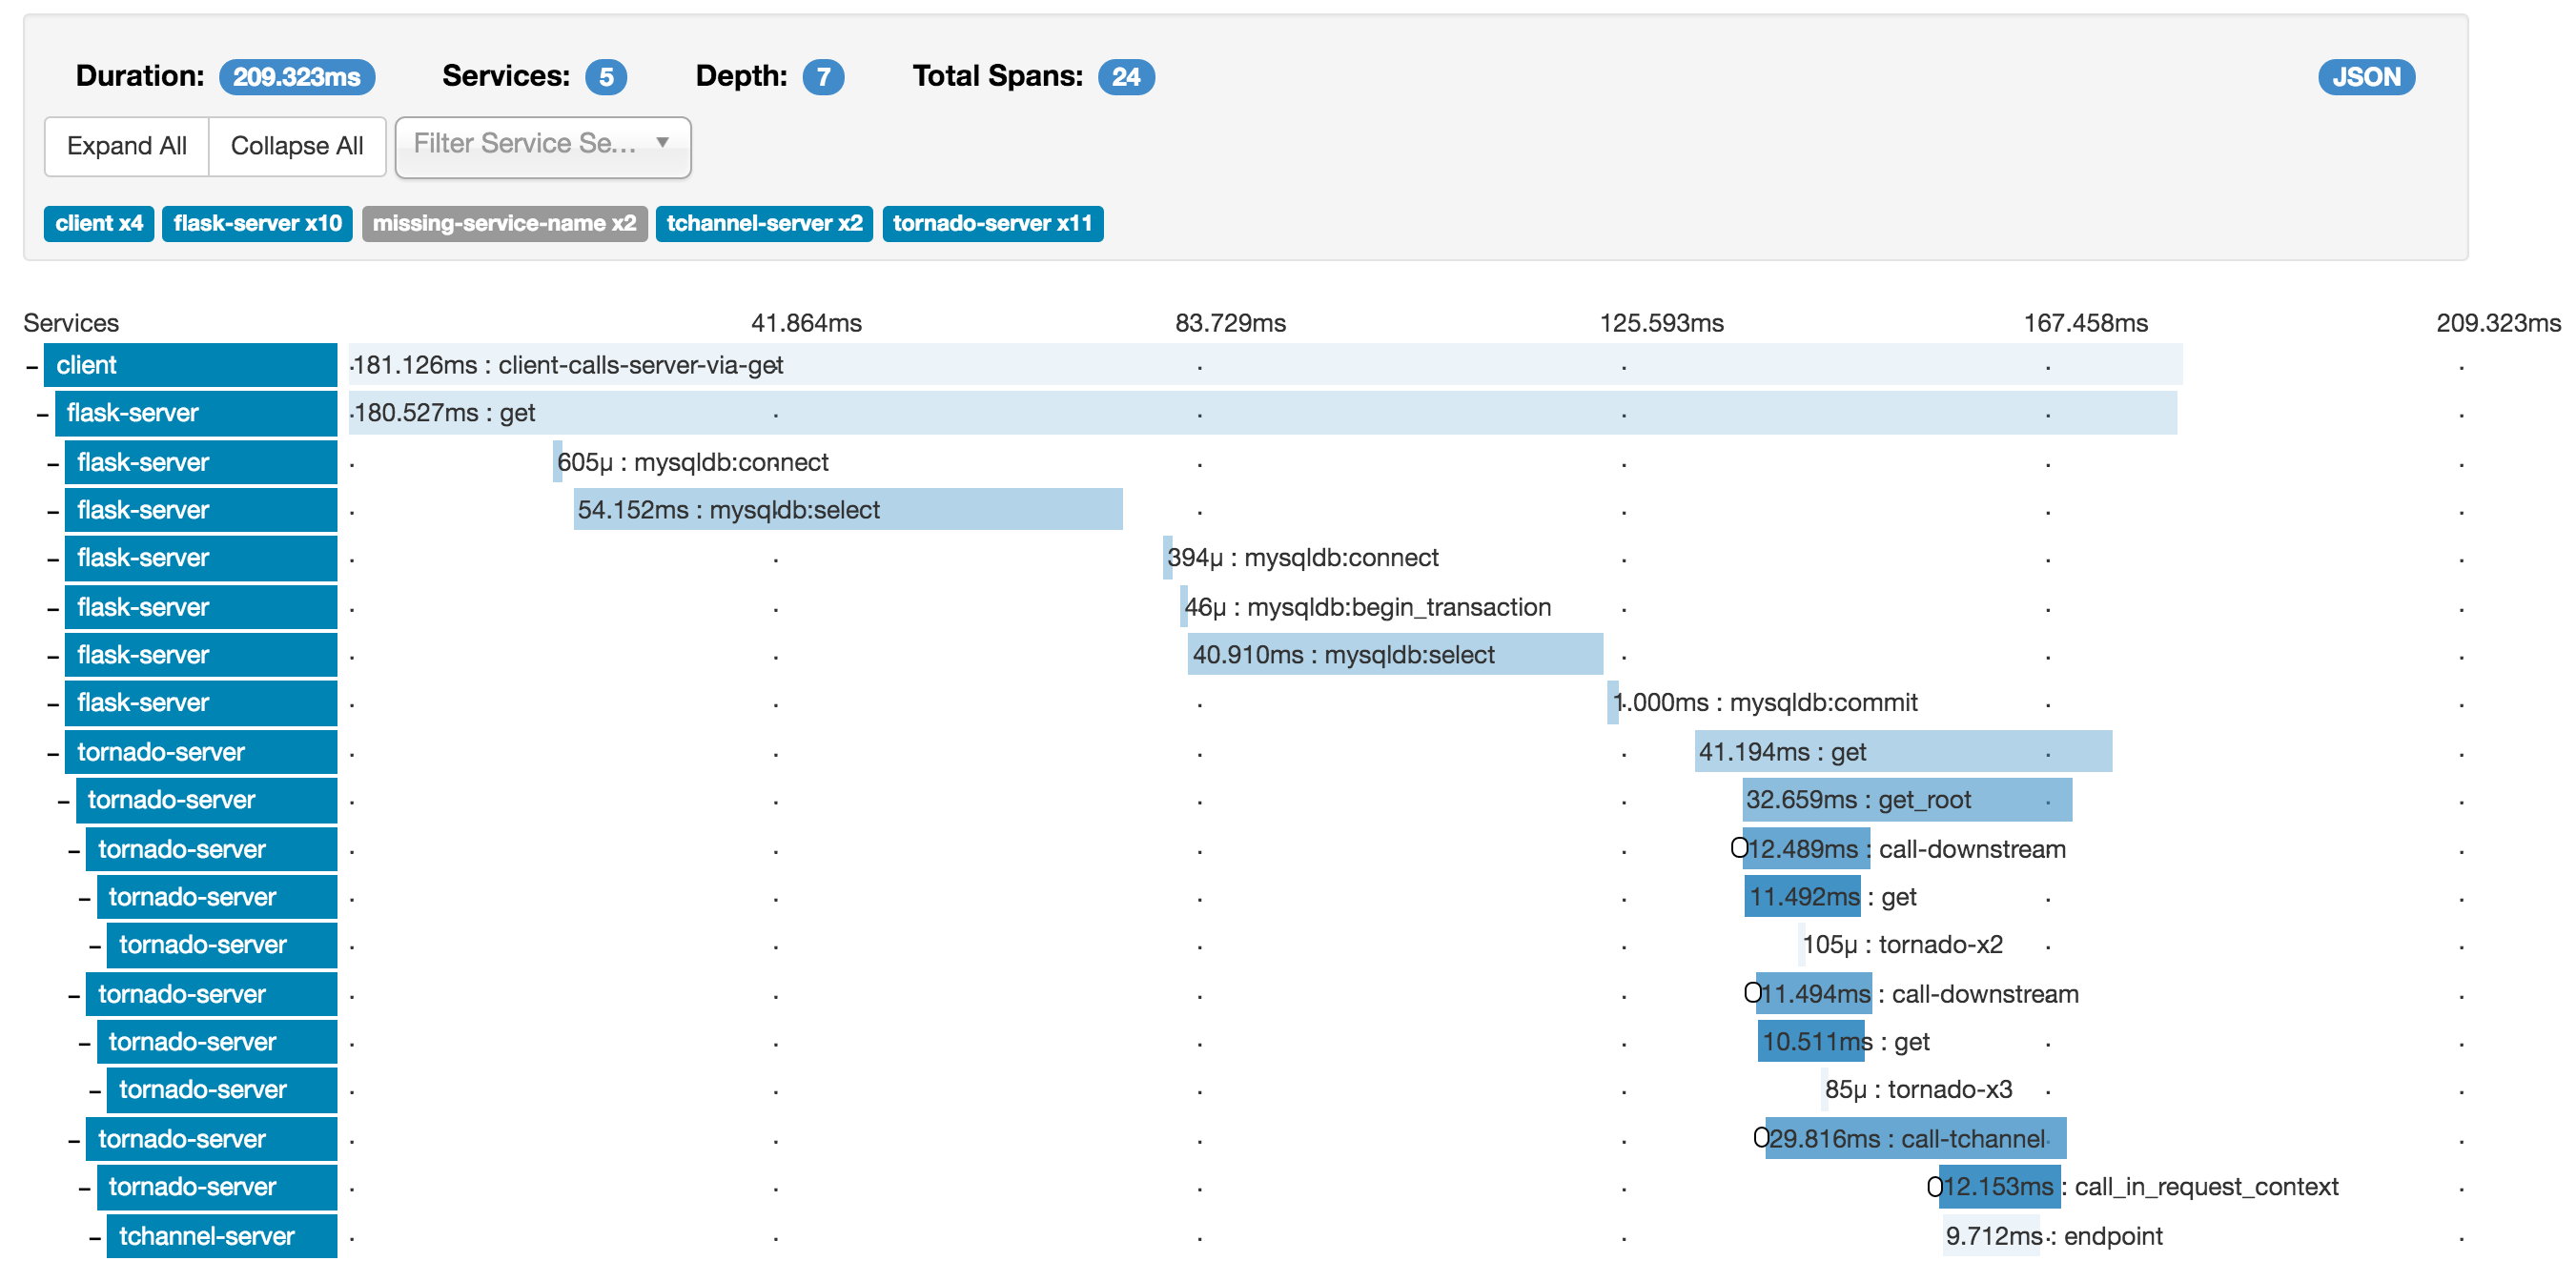
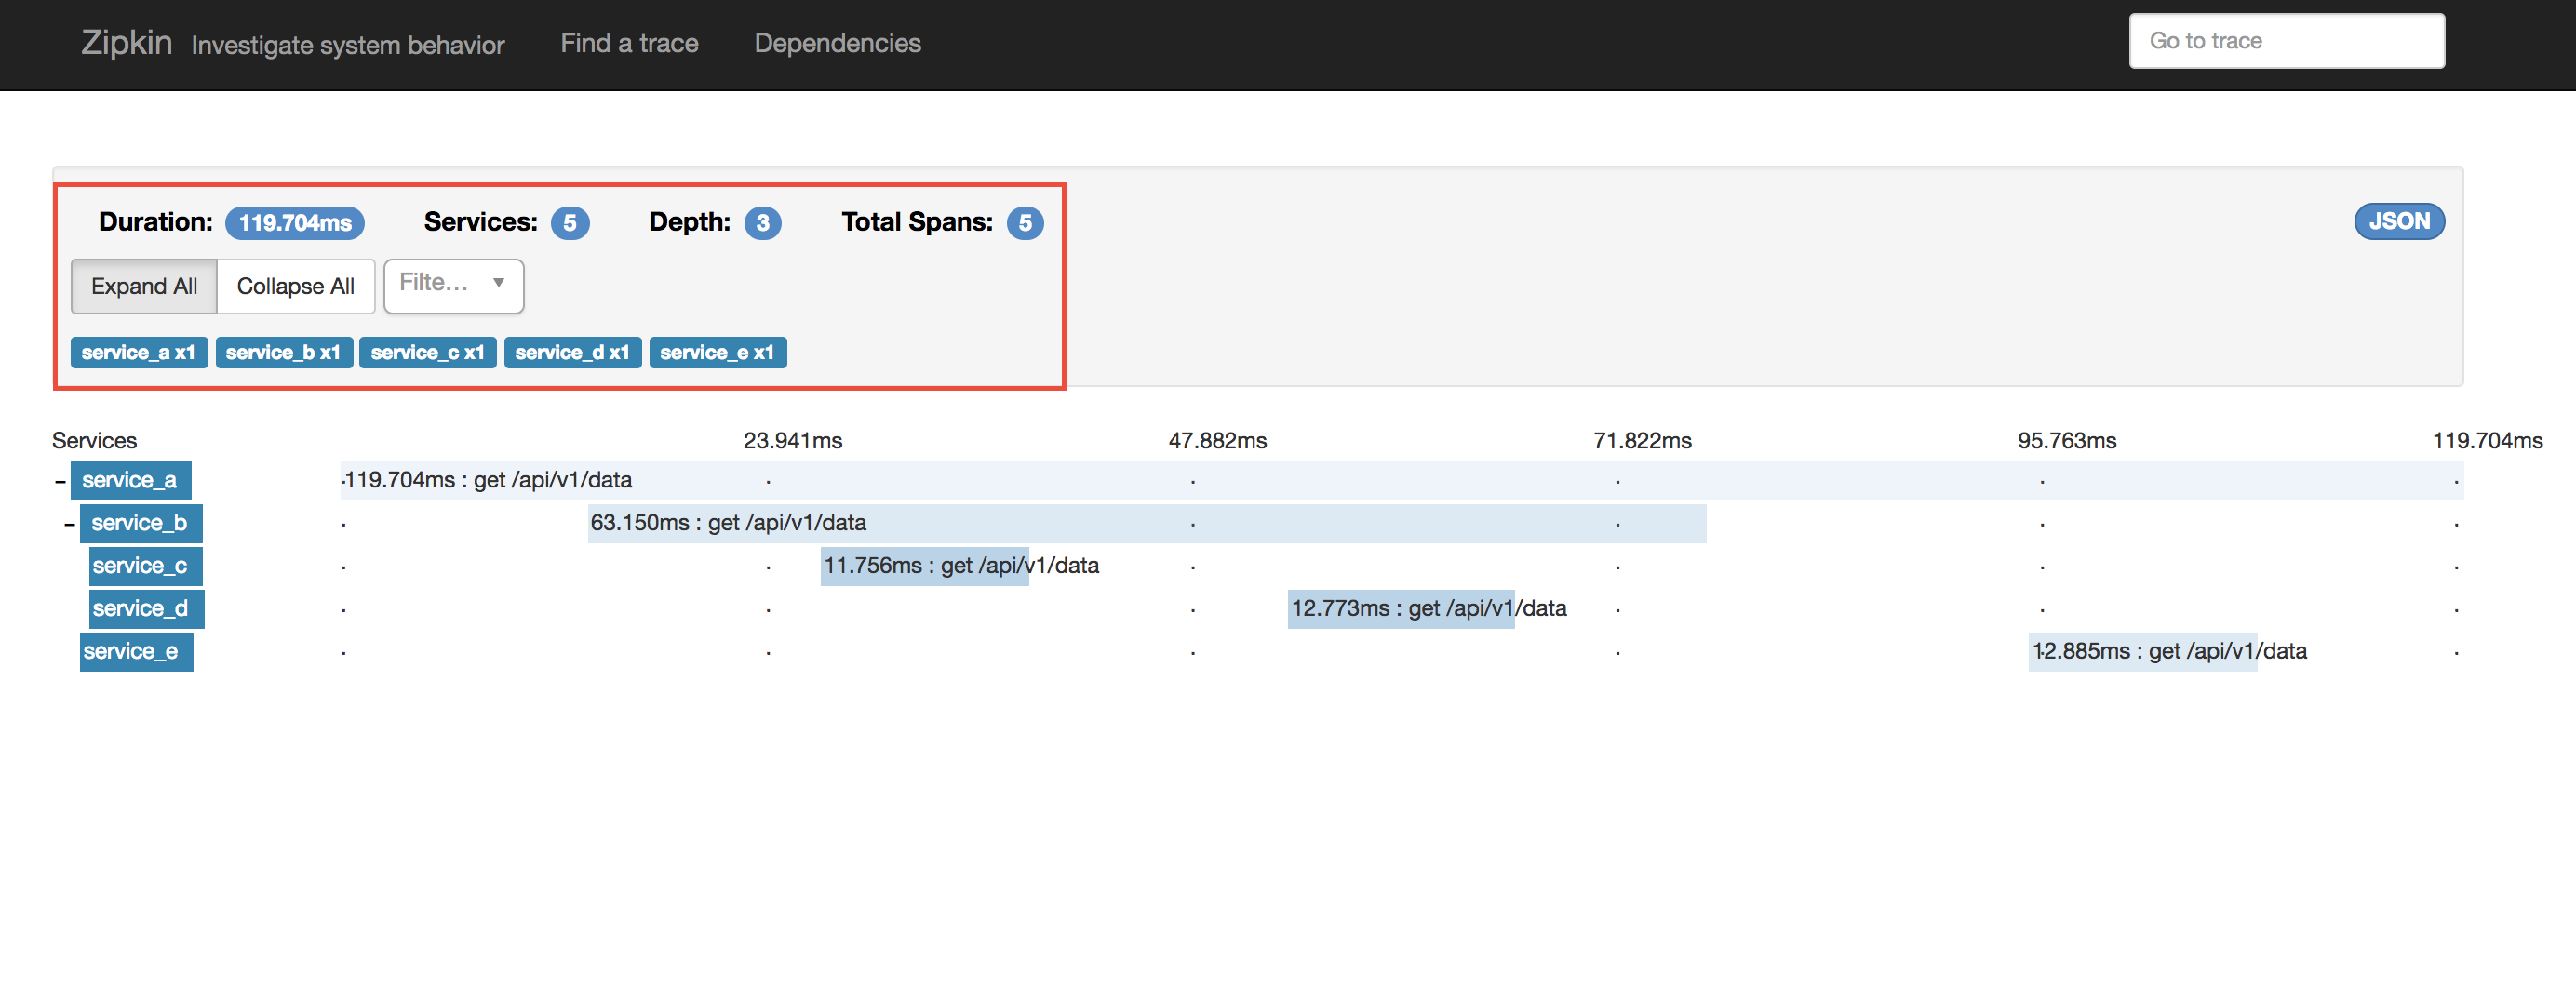
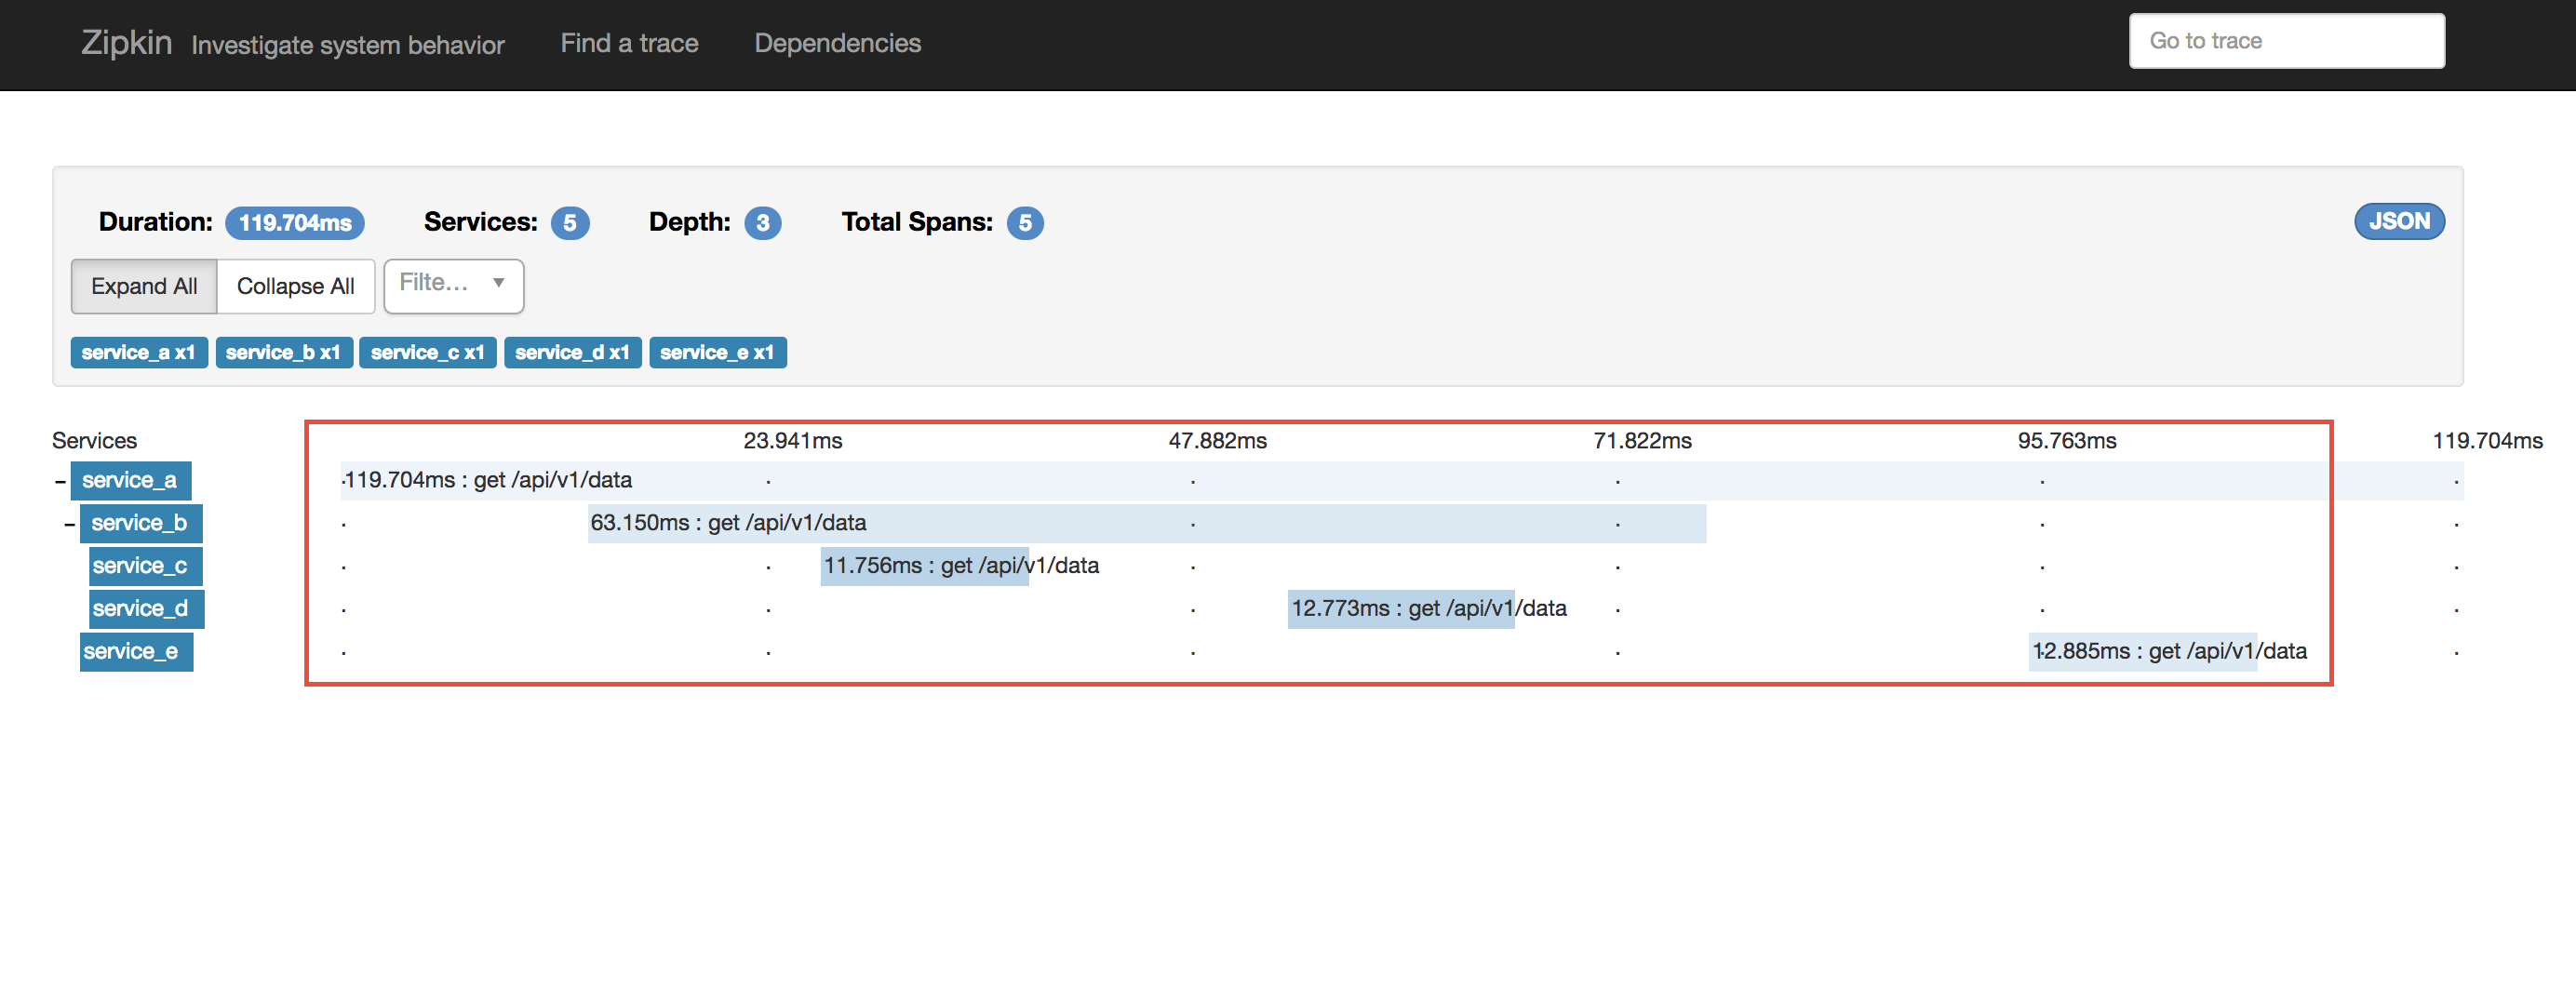
Identifying Services interacting with request
Identifying duplicate calls
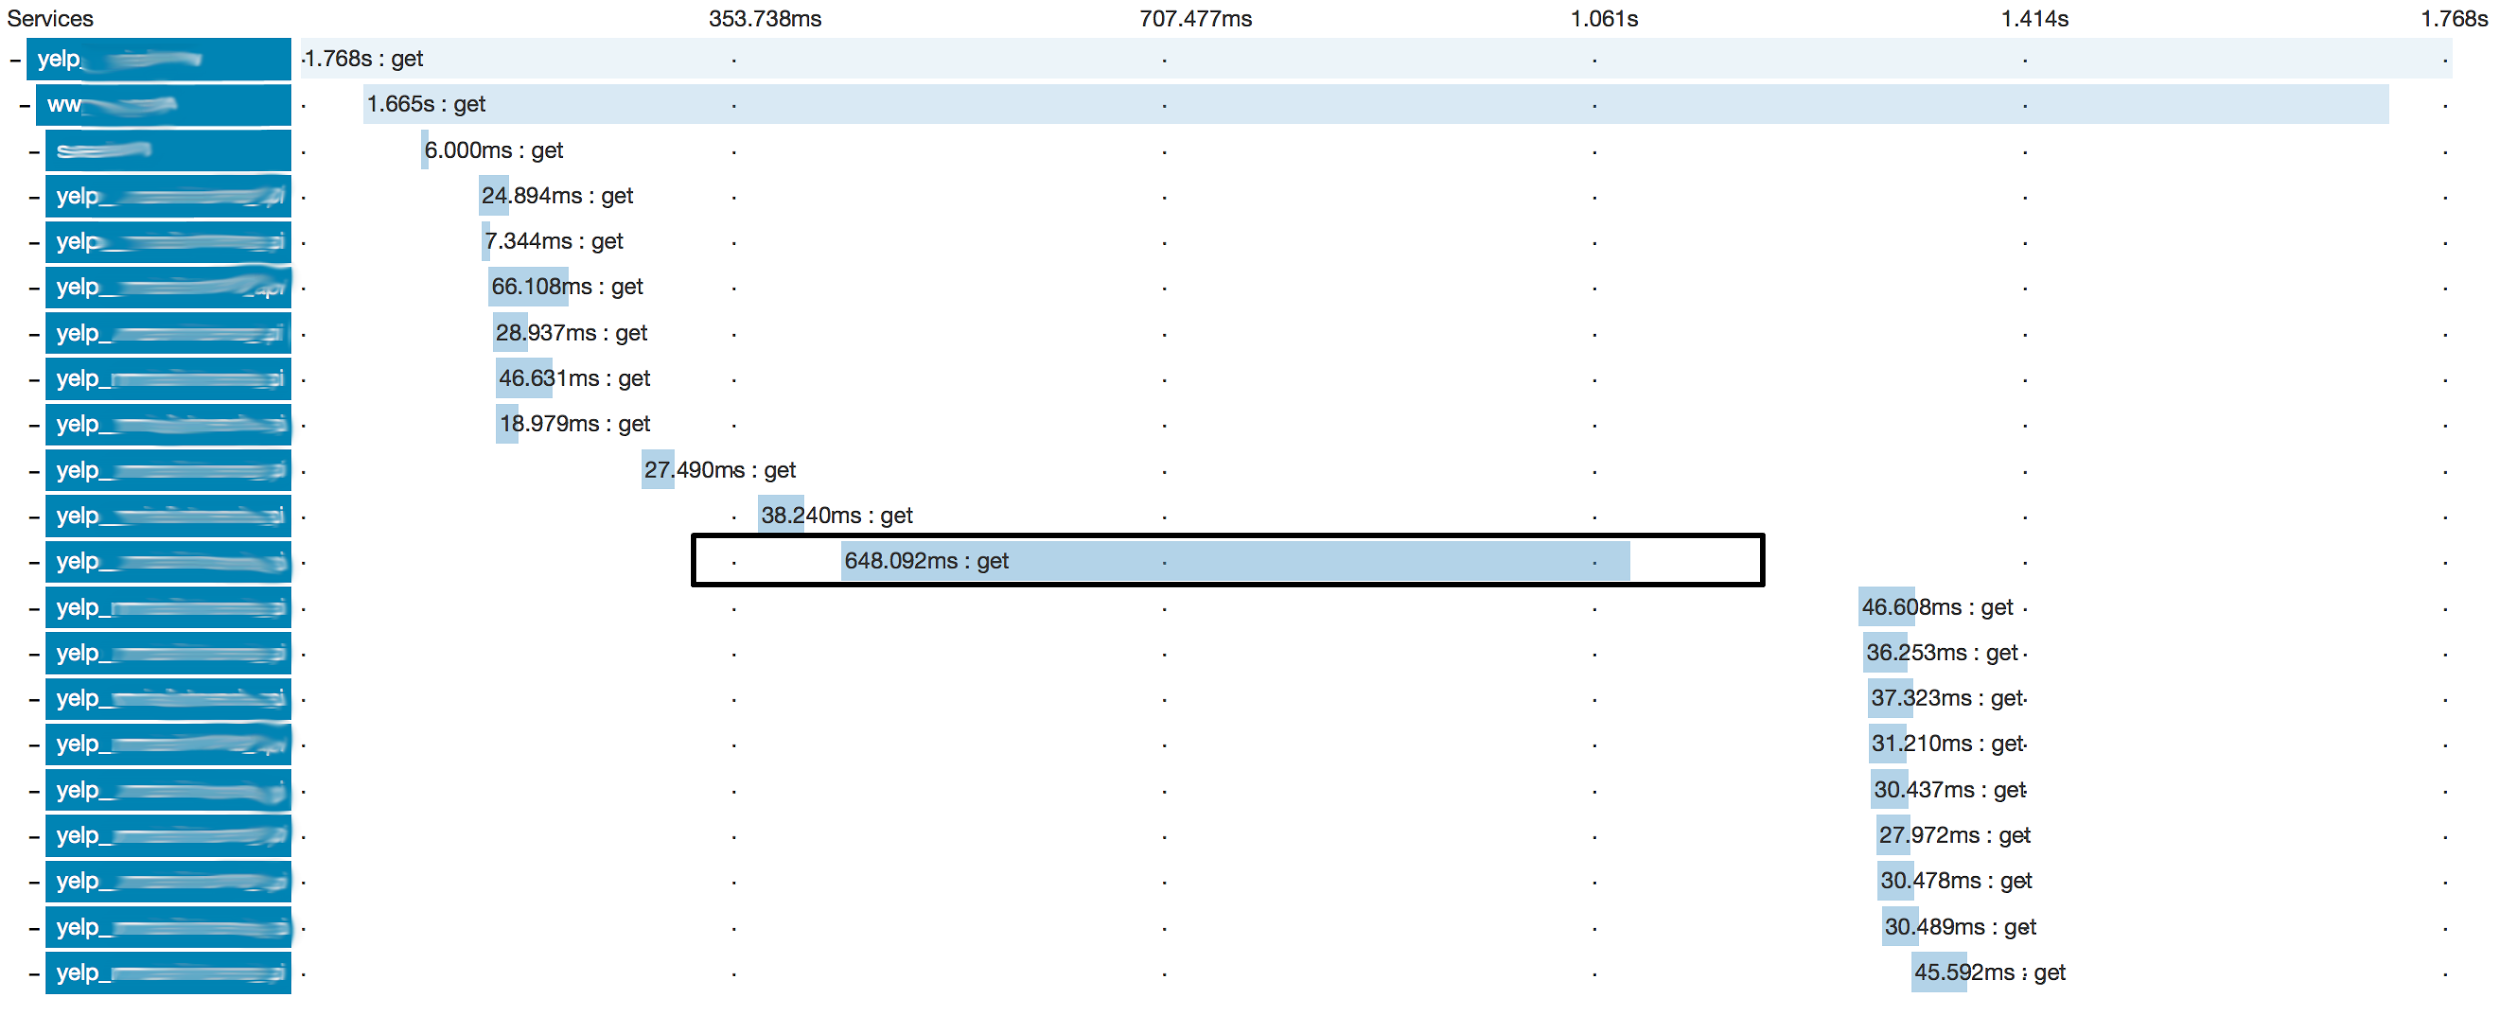
Identifying Slow requests
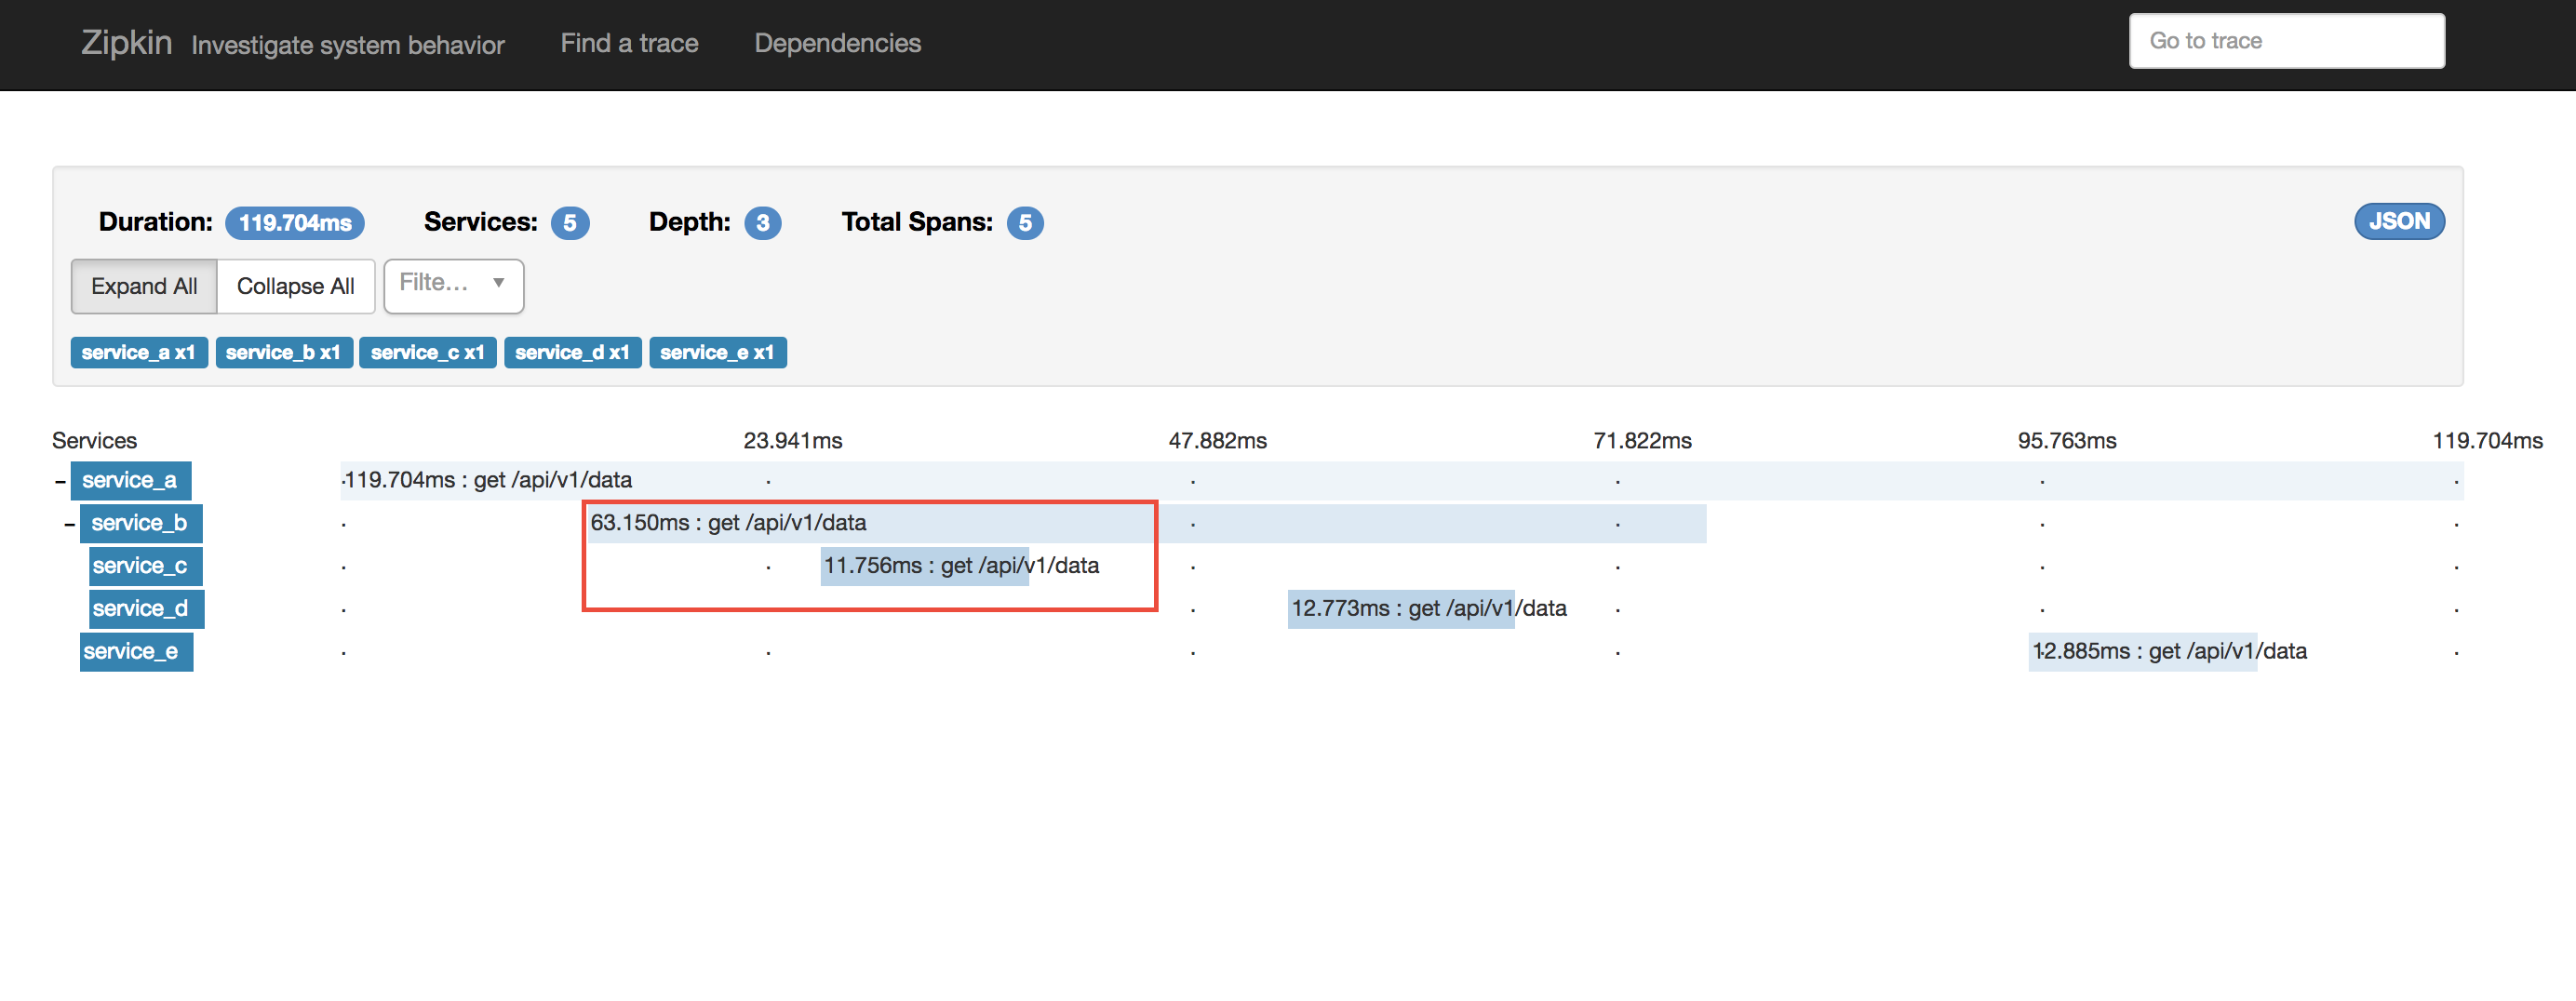
Identifying serial execution
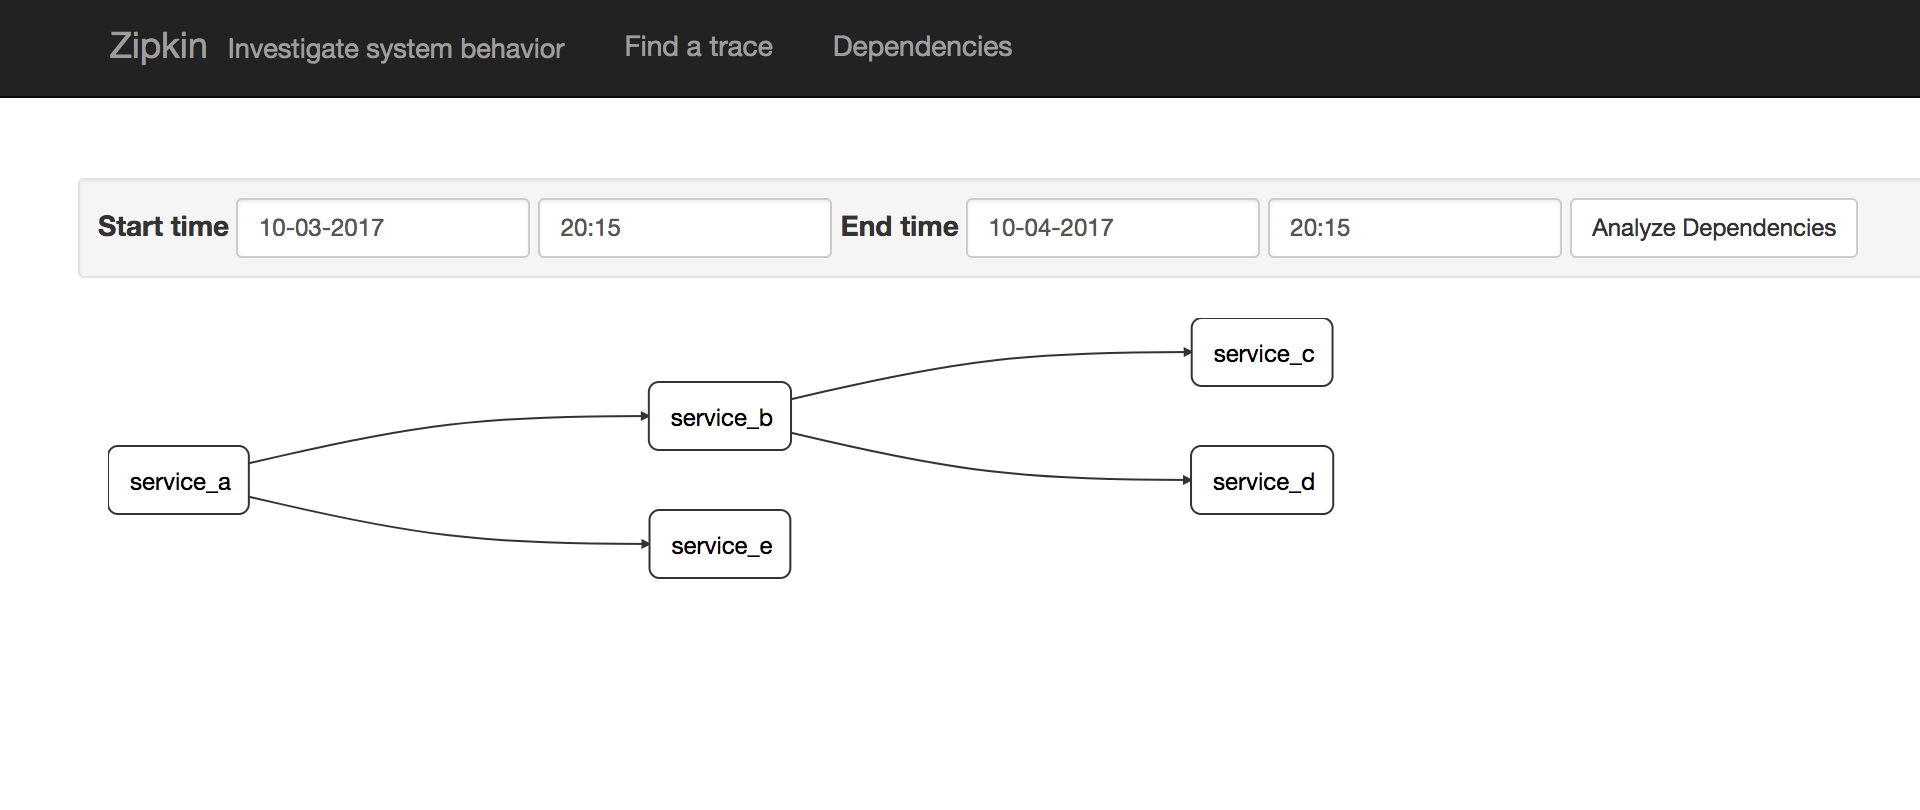
Service dependency analysis
Zipkin python story
| Name | github | stars |
|---|---|---|
| py_zipkin | github.com/Yelp/py_zipkin | 61 ★ |
| pyramid_zipkin | github.com/Yelp/pyramid_zipkin | 23 ★ |
| flask-zipkin | github.com/qiajigou/flask-zipkin | 14 ★ |
| django-zipkin | github.com/prezi/django-zipkin | 19 ★ |
| aiozipkin | github.com/aio-libs/aiozipkin | 10 ★ |
Zipkin for asyncio: aiozipkin
import aiozipkin as az

async def run():
    zipkin_address = "http://127.0.0.1:9411"
    endpoint = az.create_endpoint("simple_service", ipv4="127.0.0.1", port=8080)
    tracer = az.create(zipkin_address, endpoint)

    # create and setup new trace
    with tracer.new_trace(sampled=True) as span:
        # give a name for the span
        span.name("Slow SQL")
        # tag with relevant information
        span.tag("span_type", "root")
        # indicate that this is client span
        span.kind(az.CLIENT)
        # make timestamp and name it with START SQL query
        span.annotate("START SQL SELECT * FROM")
        # imitate long SQL query
        await asyncio.sleep(0.1)
        # make other timestamp and name it "END SQL"
        span.annotate("END SQL")
aiozipkin annotations
    with tracer.new_trace(sampled=True) as span:
        span.name("Slow SQL")

        span.annotate("START SQL SELECT * FROM")
        await asyncio.sleep(0.1)

        span.annotate("END SQL")
        await asyncio.sleep(0.1)
aiozipkin nested spans
    # create and setup new trace
    with tracer.new_trace(sampled=True) as span:
        span.name('root_span')
        await asyncio.sleep(0.1)

        # create child span
        with tracer.new_child(span.context) as nested_span:
            nested_span.name('nested_span_1')
            await asyncio.sleep(0.01)

        # create other child span
        with tracer.new_child(span.context) as nested_span:
            nested_span.name('nested_span_2')
            await asyncio.sleep(0.01)
aiozipkin aiohttp
Client Side
    with tracer.new_trace(sampled=True) as span:
        span.kind(az.CLIENT)
        headers = span.context.make_headers()
        resp = await session.get(host, headers=headers)
        await resp.text()
def make_app(host, port, loop):
    app = web.Application()
    endpoint = az.create_endpoint(
        'aiohttp_server', ipv4=host, port=port)
    tracer = az.create(zipkin_address, endpoint, sample_rate=1.0)
    az.setup(app, tracer)
aiozipkin application transparency
- Developers are lazy, for better experience libraries should be instrumented
- Other vendors like datadog, newrelic et, will benefit too (right now they monkey patch everything)
- asyncio right now does not support contest variables like thread locals, PEP 550 addresses this issue
- aiohttp HTTP client instrumentation in progress
References
- Sigelman, B. H., Barroso, L. A., Burrows, M., Stephenson, P., Plakal, M., Beaver, D., Jaspan, S., and Shanbhag, C. Dapper, a Large-Scale Distributed Systems Tracing Infrastructure. Technical Report, Google, 2010.
- Mace, J. End-to-End Tracing: Adoption and Use Cases. Survey, Brown University, 2017.
Thank you!

aio-libs: https://github.com/aio-libs